الثلاثاء، أغسطس 28، 2018

Inside Bar

What Is Inside The Inside Bar?

Our testing revealed that wide range inside bars (with range more
than 75% of the range of the preceding bars) out-performed our
benchmark by the largest margin. These are bars that barely make
it as inside bars and represent only a slight contraction.
We also found that inside bars that closed in our trade direction
seems to have an edge. Inside bars that support our trades did
considerably better than inside bars that did not.
The other two factors open-to-close spread and volume did not
show significant improvement.
We focused on wide range inside bars that closed in the direction
of our trade.

The results are encouraging. Most of the futures contacts show
an improvement of over 8%. This is a significant edge in the
competitive field of day trading. Of course, I must emphasis the
naive and simplistic assumptions we made. This includes the 1:1
risk to reward ratio and using the 20-period EMA as a trend filter.
Our results are not meant to be used in isolation as a complete
trading system. However, this is a good start to understand more
about inside bars that occur in day trading time frames.

Relative Volume of Inside Bar

Relative Volume of Inside Bar

Our hypothesis is this: High volume inside bars contain more
activity which leads to stronger breakouts. “High” is relative, so we
compared the volume of the inside bar to that of its preceding bar.
In our testing, inside bars with volume higher than 75% of the
volume of the preceding bar are considered high volume inside
bars. Inside bars with volume lower than 25% of the volume of
the preceding bar are considered low volume inside bars.

الثلاثاء، أبريل 03، 2018

Bullish pattern & Bearish pattren


10 TYPES OF CHARTS

Types of Price Charts


CHART PROVIDER 

MNY BROKERAGE COMPANY GIVES CHART FOR TRADING IN FREE OF COST  SO WE CAN OPEN ACCOUNT UNDER ANY SUB BROKERS TO ACCESS LIVE CHARTS WE CAN ACCESS DIFFERENT KINDS OF CHART PATTRENS MOST USE CHART AND MANY PROFESSIONAL TRADERS USING CHARTS ARE CANDLE STICK PATTRENS ,RENKO CHARTS, HEKKINASHI CHARTS 

TRADING TIME FRAME

Do you trade with the 5-minute chart? Or the daily chart? But why are we constrained by time bases?
Are there other ways to visualise price data? Do they offer valuable perspectives? you can use 15 min ,30 min ,hourly charts for intrady trading,longer time frame gives you more accuracy

(Beware. They might turn your trading perspective upside down.)
For easy comparison, we are using the same two trading sessions as
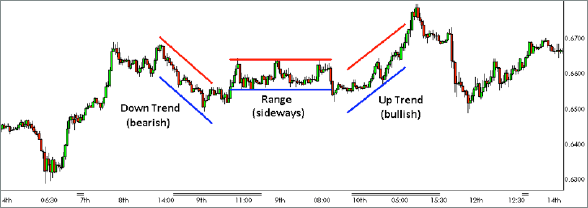
examples for each chart type. One chart shows a clear trend while
the other will shows a trading range.

1. Line Chart

it shows only line on the graphs you can watch high and low of charts it is ver simple chart to understand the market is high or low

2. Bar Chart

shows only bars on chartwatch high and low of charts it is ver simple chart to understand the market is high or low

3. Candlestick Chart

candle shows vwer clear view in chart it gives you perfect entrys in trading

4. Volume Chart the volume chart shows volume on candle it shows hgh volume candle and low volume candles

5. Tick Chart
6. Range Bar Chart
7. Point & Figure Chart

8. Renko Chart

renko charts are using only invest ment processes not for daytradng

9. Kagi Chart
10. Three-Line Break Chart

الجمعة، مارس 16، 2018

Technical Analysis

What is Technical Analysis?


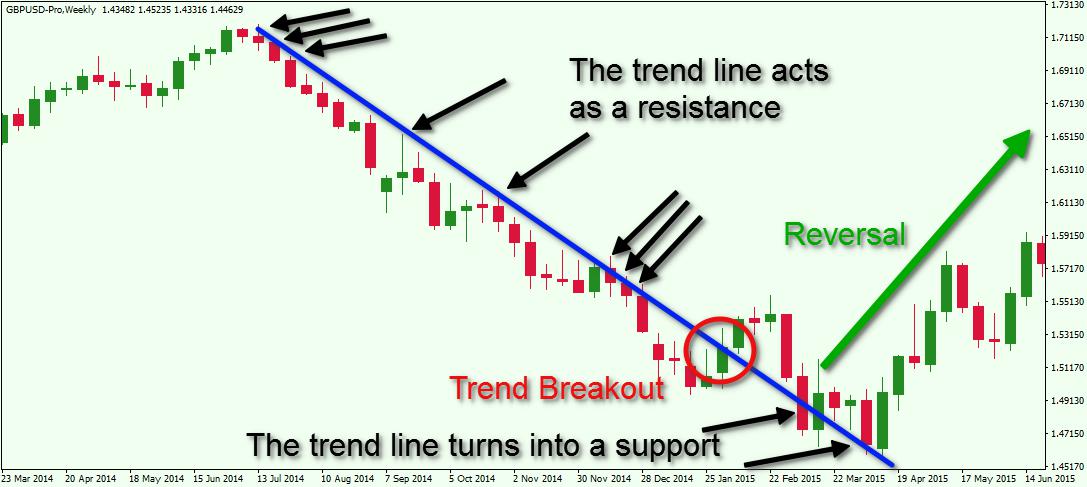
TECHNICAL ANALYISIS HELPS  YOU TO FIND  WHER YOU PARTICIPATE IN MARKET ,Technical Analysis can be defined as an art and science of forecasting future prices based on an examination of the past price movements. 

TECHNICAL ANALYSISI SHOWS YOU RIGHT PATH

Technical analysis is not astrology for predicting prices. Technical analysis is based on analyzing current demand-supply of commodities, stocks, indices, futures or any tradable instrument. Technical analysis involve putting stock information like prices, volumes and open interest on a chart and applying various patterns and indicators to it in order to assess the future price movements. You can enter at righ side eitherbuy or sell

TIME FRAME FOR TRADING

 The time frame in which technical analysis is applied may range from intraday (1-minute, 5-minutes, 10-minutes, 15-minutes, 30-minutes or hourly), daily, weekly or monthly price data to many years. There are essentially two methods of analyzing investment opportunities in the security market viz fundamental analysis and technical analysis. You can use fundamental information like fi nancial and non-fi nancial aspects of the company or technical information which ignores fundamentals and focuses on actual price movements.

 http://tamilsharetip.blogspot.in/

The basis of Technical Analysis What makes Technical Analysis an effective tool to analyze price behavior is explained by following theories given by Charles Dow:

• Price discounts everything 
• Price movements are not totally random
• What is more important than why