الخميس، أكتوبر 04، 2018
INTRADAY STOCKS
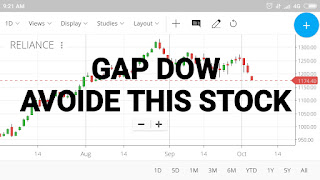
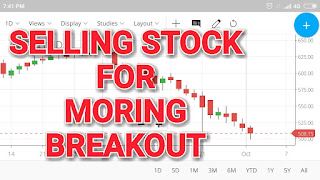
When super trend 7, 0.9 Ema crossover done its ready for sell but watch live trade
For more details kindly watch our youtube video :Click to watch
الأربعاء، أكتوبر 03، 2018
MARKETS LIVE: Indices trim losses, Nifty above 10,950; rupee breaches 73/$
The benchmark indices trimmedd some of their morning losses and are now trading marginally lower amid a weak rupee which slipped below 73 per dollar mark for the first time to hit an all-time low of 73.34 in intraday deals.
The Indian currency dropped to a record low in opening deals on Wednesday as a sharp rise in global crude oil prices over the last two sessions weighed on sentiment for the local unit.
Among sectoral indices, the Nifty Auto index has slipped over 1.5 per cent weighed by losses in the shares of Mahindra & Mahindra (M&M) and Maruti Suzuki.
RBI monetary policy
Going ahead, investors will keep a close watch on the Reserve Bank of India's (RBI) decision on key interest rates. The RBI's monetary policy committee will start its three-day meeting from Wednesday to decide on the fourth bi-monthly monetary policy. After two successive hikes, the repo-rate currently stands at 6.50 per cent.
Global Markets
Asian shares ticked lower on Wednesday and the euro held at six-week lows as Italy’s mounting debt and Rome’s budget plan set it on a collision course with the European Union.
Investors remained jittery even as a new US-Mexico-Canada trade agreement appeared to ease global trade tensions. A controversial clause in the trilateral pact put the focus back on the Sino-US tariff dispute.
Japan's Nikkei eased 0.1 per cent on a stronger yen while South Korea's KOSPI index slipped 1.3 per cent.
China’s financial markets are closed for the National Day holiday and will resume trade on October 8. The markets in the world’s second-biggest economy have taken a hammering this year as investors fretted the trade dispute could put a significant dent on growth.
OVER 170 STOCKS HITS 52 WEEKS LOW
NEW DELHI: Over 170 stocks, including Bharti Airtel, Bharti Infratel, Eicher Motors and 8K Miles Software Services, hit 52-week lows on NSE in Wednesday's session.
Bandhan Bank, HUDCO, Indiabulls Real Estate, ICICI Securities, J.Kumar Infraprojects, Jaiprakash Power Ventures, Jubilant Industries, Kewal Kiran Clothing, Max Financial Services, Supreme Industries, Tata Communications, TI Financial Holdings, TPL Plastech, Vakrangee, Walchandnagar Industries and Zuari Global also fetured among stocks that touched 52-week lows on NSE.
Domestic equity market was radiating bearish sentiment in Wednesday's session amid weak global cues and rupee's fresh fall against the US dollar
الثلاثاء، أكتوبر 02، 2018
INDICATORS FOR TRADING
The most useful information from indicators is here. Traders use it for assessment of the market scenario before trading.
- Direction of the current market trend
- Momentum in the investment market
- Chances of profit
- Volume assessment to know the popularity of the market
- Demand and supply trading theory
The crux lies in finding a right mix of the indicators for profitable decision. Too much of information might spoil the strategy. Use always best combination of indicators for day trading.
Oscillators
Oscillators type of indicators reflects up and down flow. Popular oscillators are Stochastics, CCI or Commodity Channel Index. Others are MACD and RSI.
Volume
Volume indicators are a mix of price data with volume. They determine how strong the trends in the terms of prices.
Overlays
Overlays indicators are Moving Averages and Bollinger Bands. Parabolic SAR and Fibonacci Extensions are other Overlays. Moving average determines trends. Fibonacci isto plan profit targets. CCI have a good number of uses like trends and trade triggers.
Breath Indicators
The Breath Indicators are stock market related. The major ones are Ticks, Tiki, Trin and also the Advance-Decline line. They relate to the sentiment of the traders. They reflect what the large part of the market is doing.
Bollinger Bands
This comprises three lines. The lines show moving average, lower limit, and the upper limit
الاشتراك في:
التعليقات (Atom)


