الثلاثاء، أبريل 03، 2018
10 TYPES OF CHARTS
Types of Price Charts
CHART PROVIDER
MNY BROKERAGE COMPANY GIVES CHART FOR TRADING IN FREE OF COST SO WE CAN OPEN ACCOUNT UNDER ANY SUB BROKERS TO ACCESS LIVE CHARTS WE CAN ACCESS DIFFERENT KINDS OF CHART PATTRENS MOST USE CHART AND MANY PROFESSIONAL TRADERS USING CHARTS ARE CANDLE STICK PATTRENS ,RENKO CHARTS, HEKKINASHI CHARTS
TRADING TIME FRAME
Do you trade with the 5-minute chart? Or the daily chart? But why are we constrained by time bases?Are there other ways to visualise price data? Do they offer valuable perspectives? you can use 15 min ,30 min ,hourly charts for intrady trading,longer time frame gives you more accuracy
(Beware. They might turn your trading perspective upside down.)
For easy comparison, we are using the same two trading sessions as
examples for each chart type. One chart shows a clear trend while
the other will shows a trading range.
1. Line Chart
it shows only line on the graphs you can watch high and low of charts it is ver simple chart to understand the market is high or low
2. Bar Chart
shows only bars on chartwatch high and low of charts it is ver simple chart to understand the market is high or low
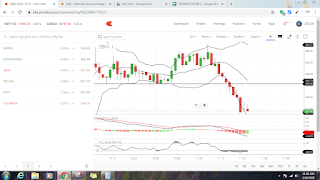
3. Candlestick Chart
candle shows vwer clear view in chart it gives you perfect entrys in trading
4. Volume Chart the volume chart shows volume on candle it shows hgh volume candle and low volume candles
5. Tick Chart6. Range Bar Chart
7. Point & Figure Chart
8. Renko Chart
renko charts are using only invest ment processes not for daytradng
10. Three-Line Break Chart
الاشتراك في:
التعليقات (Atom)

