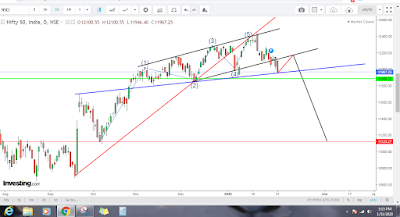
Trendline trading
Trend line the name defines it shows at rent in the market whenever you select any stock for trading you can draw a trend line to know the direction of the market Trend you can identify that trend in the market are consolidation in the market using trend line many indicators are fail to show property trend in the market but at train line is a traditional technique that is used in technical analysis for analyzing market trend upcoming friend also it shows very easily so in technical analysis trend lines are used to to find the trend direction and it is used to make huge profit in live market it is also used in investing and intraday trading you can see dynamic lines down to up and connected one point to another points is called dynamic trend line
How to draw trend line
Draw trend line high to high draw tren dline connect low to low

Open chart click a trend line option connect the price points like shown in the picture ,It is the right way to show the afternoon and you can see the image to understand how to draw the trend line properly that trend lines are used to show entry points and exit points where to buy where to sell high and low of the market are identified by the trend line the indicators are fail to show the trend many times indicators will gives a false signal in technically trend line gives a perfect signal at connect the trend line properly to find a perfect Trend using this traditional method
Trend line breakout
If you have any doubt to draw trend line watch this video to understand how to draw a basic trend lines whenever the train line will started moving up it shows uptrend the line moving down it shows down Trend you can easily identify where the market is going
Combined with volume
Trend line whenever the Breakout is happen you can see the huge volume is created at downside and then the previous trend will be break the new trend will be form in the price chart
You can also use it to understand absorption and exhaustion in the market because volume and candlestick are very important things to understand price movement
Support and resistance
Understanding support and resistance online also considered as a support and resistance the horizontal lines in the chart is called as a perfect support and resistance cross lines and dynamic lines are called as trend lines so the trendline is a dynamic support and resistance whenever the price reaches resistance seller will start selling at the height of the market because the resistance is considered as a overvalue area whenever the price reaches support buyers will enter the market
