Tuesday, June 09, 2020

HOW TO MAKE MONEY DAY TRADING

HOW TO MAKE PROFIT INTRADAY TRADING IN INDIA :

Hello every one i am full time trader i am very happy to share you what are the techniques i am followed in market ,how professional traders making huge money in trading and today i am going to show you how to make good profitable trade ,plan your trade why because Before entering a trade you may control your emotions your are making money for living 

not gambling so kindly avoid greed in trading,follow rules in trading make huge profit and cut losses

HOW MUCH DO DAY TRADERS MAKE :

don’t expect to make too much of money in a single trade,try to make consistent profit in daily basis's
professional traders did not expect quick money if they take any trade they know very well where to enter where to exit because they follow rules in trading 

CLIK TO WATCH VIDEO HOW TO MAKE MONEY TRADING :


HOW TO MAKE MONEY IN TRADING STOCKS :

don't take more than two trades in a day because you pay more money for Taxes and losses for brokerage and important thing you have limited time to carry your positions in intrady trading so you have time limit in day trading,

HOW TO EARN MONEY IN SHARE MARKET DAILY :

professional traders follows money management principle it is more important for traders who want to money in trading learn how to make profit in stock market to know about how professional traders money making in trading make use of it free educational content

Monday, June 08, 2020

BULLISH PATTERNS REVERSAL CANDLESTICK PATTERNS HOW TO TRADE

Hammer candle :

Hammer is Bullish reversal pattern or the rules will be given below the para how to trade hammer candlestick pattern whenever the hammer candlestick it is considered as the low of considered as  support In this matter the price can flat are trending bullish  hammer gives a  up Trend .

Reversal candle patterns :


The reversal candlestick supports at the low of the downtrend  when the downtrend getting weaker the hammer candle will be formed at the lowest so the buyers are interested to buy at low the market price so show the candle closes about be considered as a bullish pattern it continuous table Trend in the market we expect a good police moment and good target in this pattern we can make high revenue from the market


Hammer candlestick pattern : watch video


It is also called as a single bullish pattern candle the lower Shadow must be at least at two times greater than a real body of this candle must come after the hammer will be  located in downtrend is valid whenever the hammer located in uptrend it is invalid so be careful when you finding in trading chart another.


Hammer candle pattren :

The hammer did not have a shadow if the upper Shadow will be very low then it is considered as the  hammer when upper shadow is high the hammer candle is invalid it is not considered as a hammer

Rules to trade hammer candle


  1. Traversal means price goes flat or goes to change another  Trend
  2. Hammer high  and low trading range
  3. Single candle bullish pattern
  4. Lower Shadow must be at least twice the height of the real body
  5. must come  after downtrend
  6. No upper shadow or very small  upper shadow
  7. Color of the real body does not matter
  8. Real body must be as small as possible
  9. Lower of the  hammer becomes support


tags : bullish reversal,reversal candlestick patterns,doji star bullish,hammer candlestick patterns,
bullish candle patterns,morning star pattern candlestick

Wednesday, June 03, 2020

CHANNEL IN TRADING

Channel in trading : 

Hello everyone thanks for visiting this site here I am going to show you how to recognize channel pattern simply many traders will not know how to trade channel pattern but it is very simple technique where the price reaches resistance sell at high where the price reaches support buy at low Red line is Resistance and green line is support it gives huge amount of profit in investing and intraday trading also. Many traders having problem how to recognize a channel pattern are classified into ascending channel descending channel the stock traded at at a particular range is called channel pattern range bound market. 

CHANNEL IN STOCK TRADING

Below this image you can see the channel pattern to identify entry and exit points

Here you can easily identify the high and low after price range the high and low price ranges are marked in Red and Green color in is called support and resistance
The support and resistance are the best entries here you can see the resistance is red line and support is green line where their price reaches assistance the sellers will going to sell where the price reaches a support the buyers going to buy in the market the price range Travels at same high and low again and again is called a channel pattern whenever the price touches the height of the resistance the seller get entry in the market whenever the price touches low buyers will entry 

Click here to watch the video:

CHANNEL TRADING IN FOREX

One of the most profitable technique in Forex trading channel pattern accumulation and distribution method whenever and distribution is completed institutional traders that channel will be break at any direction it depends upon the strength of the trend whenever the buyers will strong the channel break high if seller are stronger in the market the price breaks down then huge rally 

Channel retest confirmation breakout entry

Whenever channel Breakout is happen wait for proper confirmation to enter a trade the price will retest a channel again once It Breaks a Range latest you can enter a trade and make profit in trading using this channel trading technique thank you so much for reading this article

Monday, June 01, 2020

Intraday stock selection strategy

BEST STOCK SELELCTION METHOD FOR INTRADAY :

Hello traders welcome to this website today I am going to show how to select intraday stocks how to make profit in intraday using this stocks selection method today we are going to see stock selection method in this video you can click and watch this video for more idea


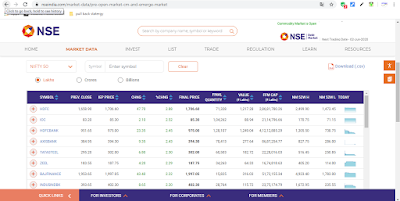
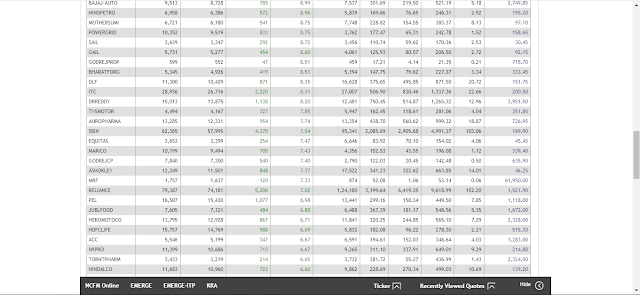
Just go to NSE India website : https://www.1.nseindia.com   you can see market data  just click market data and select pre open market   number of stocks listed here  how to select stocks just select top 5 stocks and scroll down you can select the under list you can add this stocks to the watch list it will works amazingly it gives good result in intraday trading.

CLICK HEAR TO WATCH VIDEO: 

Second type : Second type go to Google website and click "oi spurts"  on the Google search engine when you hit the search button you can see the first link 

https://www1.nseindia.com/products/content/equities/equities/oi_spurts.htm  

open interest stocks will be displayed in this website you can select the stocks which can move more than 6 % of open interest when price also increases and open interest also increases more than six percent its a good stock for trading .

This technique you can watch a stock price also increases and volume also increases open interest also increases for buying .

 For selling price decrease volume increases open interest increases in this stock is ready for sell.

How to select stocks from top gainers

Go to NSE India website under select top 10 gainers and losers  in top you can see F&o securities can select stock not move more than 1 % 

 Final step final strategy

 open any stock in your trading platform you can watch price also increases step-by-step and volume also increases for buying


Tuesday, May 19, 2020

HOW TO TRADE TRENDLINE BREAKOUT | INTRADAY GUIDE

Trendline trading

Trend line the name defines it shows at rent in the market whenever you select any stock for trading you can draw a trend line to know the direction of the market Trend you can identify that trend in the market are consolidation in the market using trend line many indicators are fail to show property trend in the market but at train line is a traditional technique that is used in technical analysis for analyzing market trend upcoming friend also it shows very easily so in technical analysis trend lines are used to to find the trend direction and it is used to make huge profit in live market it is also used in investing and intraday trading you can see dynamic lines down to up and connected one point to another points is called dynamic trend line

How to draw trend line

Draw trend line high to high draw tren dline connect low to low 
Open chart click a trend line option connect the price points like shown in the picture ,It is the right way to show the afternoon and you can see the image to understand how to draw the trend line properly that trend lines are used to show entry points and exit points where to buy where to sell high and low of the market are identified by the trend line the indicators are fail to show the trend many times indicators will gives a false signal in technically trend line gives a perfect signal at connect the trend line properly to find a perfect Trend using this traditional method

Trend line breakout

If you have any doubt to draw trend line watch this video to understand how to draw a basic trend lines whenever the train line will started moving up it shows uptrend the line moving down it shows down Trend you can easily identify where the market is going

Combined with volume

Trend line whenever the Breakout is happen you can see the huge volume is created at downside and then the previous trend will be break the new trend will be form in the price chart
You can also use it to understand absorption and exhaustion in the market because volume and candlestick are very important things to understand price movement

Support and resistance 

Understanding support and resistance online also considered as a support and resistance the horizontal lines in the chart is called as a perfect support and resistance cross lines and dynamic lines are called as trend lines so the trendline is a dynamic support and resistance whenever the price reaches resistance seller will start selling at the height of the market because the resistance is considered as a overvalue area whenever the price reaches  support buyers will enter the market