Wednesday, October 03, 2018

MORNING BREAKOUT STATERGY FOR TOMARROW

OCTOBER :4 
MORNING BREAKOUT STOCK FOR SELLING

TOMORROW CONCENTRATE ON RELINCE STOCK ,IF THE CANDLE BREAKS LOW IT WILL GIVES AGOOD FLOW IN SELLING ,
CONCENTRATE ONLY IN SELLING SIDE ON RELINCE STOCK.


MARKETS LIVE: Indices trim losses, Nifty above 10,950; rupee breaches 73/$

The benchmark indices trimmedd some of their morning losses and are now trading marginally lower amid a weak rupee which slipped below 73 per dollar mark for the first time to hit an all-time low of 73.34 in intraday deals.

The Indian currency dropped to a record low in opening deals on Wednesday as a sharp rise in global crude oil prices over the last two sessions weighed on sentiment for the local unit.

Among sectoral indices, the Nifty Auto index has slipped over 1.5 per cent weighed by losses in the shares of Mahindra & Mahindra (M&M) and Maruti Suzuki.

RBI monetary policy
Going ahead, investors will keep a close watch on the Reserve Bank of India's (RBI) decision on key interest rates. The RBI's monetary policy committee will start its three-day meeting from Wednesday to decide on the fourth bi-monthly monetary policy. After two successive hikes, the repo-rate currently stands at 6.50 per cent.

Global Markets

Asian shares ticked lower on Wednesday and the euro held at six-week lows as Italy’s mounting debt and Rome’s budget plan set it on a collision course with the European Union.

Investors remained jittery even as a new US-Mexico-Canada trade agreement appeared to ease global trade tensions. A controversial clause in the trilateral pact put the focus back on the Sino-US tariff dispute.

Japan's Nikkei eased 0.1 per cent on a stronger yen while South Korea's KOSPI index slipped 1.3 per cent.

China’s financial markets are closed for the National Day holiday and will resume trade on October 8. The markets in the world’s second-biggest economy have taken a hammering this year as investors fretted the trade dispute could put a significant dent on growth.

OVER 170 STOCKS HITS 52 WEEKS LOW

NEW DELHI: Over 170 stocks, including Bharti Airtel, Bharti Infratel, Eicher Motors and 8K Miles Software Services, hit 52-week lows on NSE in Wednesday's session.
Bandhan Bank, HUDCO, Indiabulls Real Estate, ICICI Securities, J.Kumar Infraprojects, Jaiprakash Power Ventures, Jubilant Industries, Kewal Kiran Clothing, Max Financial Services, Supreme Industries, Tata Communications, TI Financial Holdings, TPL Plastech, Vakrangee, Walchandnagar Industries and Zuari Global also fetured among stocks that touched 52-week lows on NSE. 

Domestic equity market was radiating bearish sentiment in Wednesday's session amid weak global cues and rupee's fresh fall against the US dollar 

Low Breakout failed

The godrej industry limted stock will not follow trend and it will not Breaks the low of previous day candle so I missed my Entry Its a failure call..

Tuesday, October 02, 2018

Breakout stock for next day

I AM CHOOSING THIS STOCK FOR SELLING

When  market sentiment is NEGATIVE STOCK FOLLOWING NEGATIVE TREND ,BREAKING PREVIOUS DAY LOW TRY FOR SELLING

Try paper trade otherwise take your own risk
FOR MORE DETAILS WATCH YOUTUBE VIDEO : TAMIL SHARE TIPS

INDICATORS FOR TRADING

The most useful information from indicators is here. Traders use it for assessment of the market scenario before trading.
  • Direction of the current market trend
  • Momentum in the investment market
  • Chances of profit
  • Volume assessment to know the popularity of the market
  • Demand and supply trading theory
The crux lies in finding a right mix of the indicators for profitable decision. Too much of information might spoil the strategy. Use always best combination of indicators for day trading.

Oscillators

Oscillators type of indicators reflects up and down flow. Popular oscillators are Stochastics, CCI or Commodity Channel Index. Others are MACD and RSI.

Volume 

Volume indicators are a mix of price data with volume. They determine how strong the trends in the terms of prices.

Overlays

Overlays indicators are Moving Averages and Bollinger Bands. Parabolic SAR and Fibonacci Extensions are other Overlays. Moving average determines trends. Fibonacci isto plan profit targets. CCI have a good number of uses like trends and trade triggers.

Breath Indicators

The Breath Indicators are stock market related. The major ones are Ticks, Tiki, Trin and also the Advance-Decline line. They relate to the sentiment of the traders. They reflect what the large part of the market is doing.

Bollinger Bands

This comprises three lines. The lines show moving average, lower limit, and the upper limit

Saturday, September 29, 2018

Selling side stock

Try this stock sellingFor Paper Trade  when market sentiment is negative ENTER LOW OF CANDLE ,
PLS DONT TAKE HIGH RISK 

Tuesday, September 25, 2018

Monday, September 24, 2018

MORNING BREAKOUT STATERGY

MARKET IS SELLING SIDE THOS 2 STOCKS BREAKS  PREVIOUS DAY LOW START SELL LOW OF PREVIOUS  DAY CANDLE

Tuesday, August 28, 2018

Inside Bar

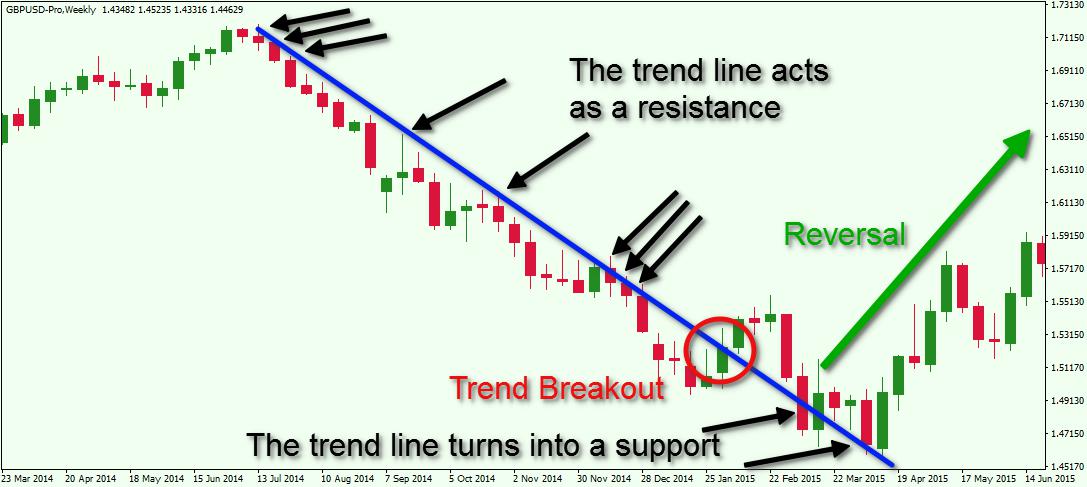
What Is Inside The Inside Bar?

Our testing revealed that wide range inside bars (with range more
than 75% of the range of the preceding bars) out-performed our
benchmark by the largest margin. These are bars that barely make
it as inside bars and represent only a slight contraction.
We also found that inside bars that closed in our trade direction
seems to have an edge. Inside bars that support our trades did
considerably better than inside bars that did not.
The other two factors open-to-close spread and volume did not
show significant improvement.
We focused on wide range inside bars that closed in the direction
of our trade.

The results are encouraging. Most of the futures contacts show
an improvement of over 8%. This is a significant edge in the
competitive field of day trading. Of course, I must emphasis the
naive and simplistic assumptions we made. This includes the 1:1
risk to reward ratio and using the 20-period EMA as a trend filter.
Our results are not meant to be used in isolation as a complete
trading system. However, this is a good start to understand more
about inside bars that occur in day trading time frames.

Relative Volume of Inside Bar

Relative Volume of Inside Bar

Our hypothesis is this: High volume inside bars contain more
activity which leads to stronger breakouts. “High” is relative, so we
compared the volume of the inside bar to that of its preceding bar.
In our testing, inside bars with volume higher than 75% of the
volume of the preceding bar are considered high volume inside
bars. Inside bars with volume lower than 25% of the volume of
the preceding bar are considered low volume inside bars.

Tuesday, April 03, 2018

Bullish pattern & Bearish pattren


10 TYPES OF CHARTS

Types of Price Charts


CHART PROVIDER 

MNY BROKERAGE COMPANY GIVES CHART FOR TRADING IN FREE OF COST  SO WE CAN OPEN ACCOUNT UNDER ANY SUB BROKERS TO ACCESS LIVE CHARTS WE CAN ACCESS DIFFERENT KINDS OF CHART PATTRENS MOST USE CHART AND MANY PROFESSIONAL TRADERS USING CHARTS ARE CANDLE STICK PATTRENS ,RENKO CHARTS, HEKKINASHI CHARTS 

TRADING TIME FRAME

Do you trade with the 5-minute chart? Or the daily chart? But why are we constrained by time bases?
Are there other ways to visualise price data? Do they offer valuable perspectives? you can use 15 min ,30 min ,hourly charts for intrady trading,longer time frame gives you more accuracy

(Beware. They might turn your trading perspective upside down.)
For easy comparison, we are using the same two trading sessions as
examples for each chart type. One chart shows a clear trend while
the other will shows a trading range.

1. Line Chart

it shows only line on the graphs you can watch high and low of charts it is ver simple chart to understand the market is high or low

2. Bar Chart

shows only bars on chartwatch high and low of charts it is ver simple chart to understand the market is high or low

3. Candlestick Chart

candle shows vwer clear view in chart it gives you perfect entrys in trading

4. Volume Chart the volume chart shows volume on candle it shows hgh volume candle and low volume candles

5. Tick Chart
6. Range Bar Chart
7. Point & Figure Chart

8. Renko Chart

renko charts are using only invest ment processes not for daytradng

9. Kagi Chart
10. Three-Line Break Chart

Friday, March 16, 2018

Technical Analysis

What is Technical Analysis?


TECHNICAL ANALYISIS HELPS  YOU TO FIND  WHER YOU PARTICIPATE IN MARKET ,Technical Analysis can be defined as an art and science of forecasting future prices based on an examination of the past price movements. 

TECHNICAL ANALYSISI SHOWS YOU RIGHT PATH

Technical analysis is not astrology for predicting prices. Technical analysis is based on analyzing current demand-supply of commodities, stocks, indices, futures or any tradable instrument. Technical analysis involve putting stock information like prices, volumes and open interest on a chart and applying various patterns and indicators to it in order to assess the future price movements. You can enter at righ side eitherbuy or sell

TIME FRAME FOR TRADING

 The time frame in which technical analysis is applied may range from intraday (1-minute, 5-minutes, 10-minutes, 15-minutes, 30-minutes or hourly), daily, weekly or monthly price data to many years. There are essentially two methods of analyzing investment opportunities in the security market viz fundamental analysis and technical analysis. You can use fundamental information like fi nancial and non-fi nancial aspects of the company or technical information which ignores fundamentals and focuses on actual price movements.

 http://tamilsharetip.blogspot.in/

The basis of Technical Analysis What makes Technical Analysis an effective tool to analyze price behavior is explained by following theories given by Charles Dow:

• Price discounts everything 
• Price movements are not totally random
• What is more important than why